Unlocking the Power of Social Media Data
Social media has become essential for businesses and professionals - from marketers and sales teams to real estate agents and content creators. But randomly posting content isn't enough. The key to success lies in understanding and analyzing engagement metrics that reveal how your audience interacts with your content.
The evolution of online analytics has come a long way from basic page view counters. Today's social platforms provide rich insights through likes, shares, comments, and clicks - actions that show genuine audience interest and engagement. These metrics tell the real story of what resonates with your followers and helps refine content strategy. Success comes from interpreting these data points effectively and adjusting your approach based on what the numbers reveal.
In this guide, we'll explore the most important social media engagement metrics and how to use them. You'll learn how to:
- Track key performance indicators
- Understand what different metrics mean
- Use data to improve your content
- Measure and increase audience engagement
- Drive better results across platforms
The goal is to help you move beyond vanity metrics and develop a data-driven social media strategy that delivers real business value. Let's dive into the metrics that matter most for social media success.
1. Engagement Rate
Ever wonder how to measure your social media content's real impact beyond basic follower counts? Engagement rate is the key metric that reveals how well your content truly connects with your audience. This essential performance indicator shows the actual level of interaction your posts generate relative to your reach.
To calculate engagement rate, take your total engagement (likes, comments, shares, saves, etc.) and divide it by your total followers or reach, then multiply by 100. This gives you a standardized way to measure performance whether you have 1,000 or 1 million followers. You can analyze individual posts or look at your account's overall engagement.
Key Benefits:
- Creates fair comparison between accounts of different sizes
- Enables benchmarking against industry standards
- Shows which content resonates most with your audience
Advantages:
- Provides more meaningful data than raw numbers
- Makes competitor analysis straightforward
- Helps identify your best content types
Limitations:
- Can be skewed by fake engagement
- Calculation methods vary by platform
- Doesn't measure interaction quality
Real Examples:
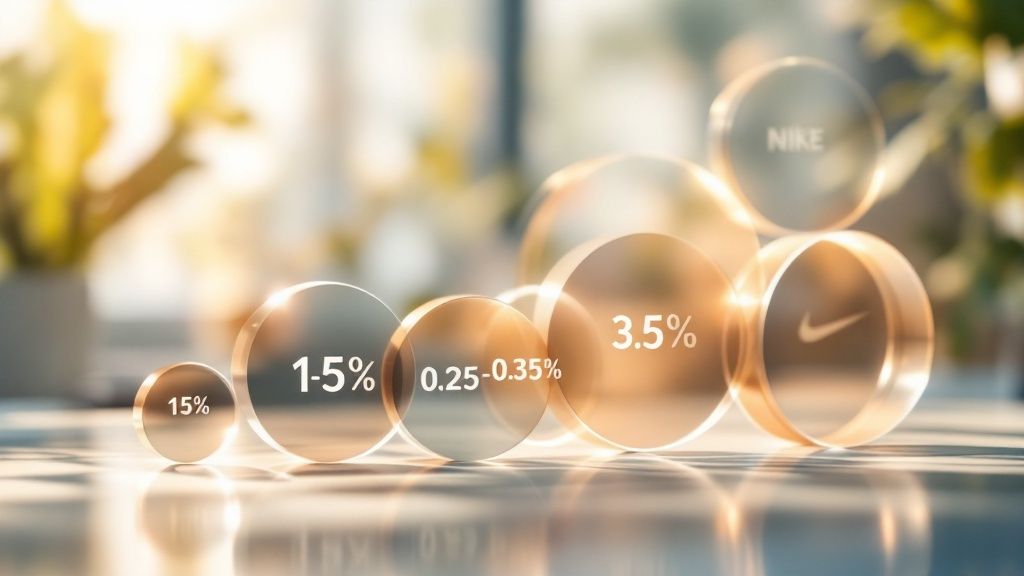
While good engagement varies by industry, Instagram typically sees 1-5% engagement rates. Larger accounts like Nike often have lower rates (around 0.25-0.35%) due to their massive following - showing why audience size matters in these calculations.
Implementation Guide:
- Monitor different content formats separately to optimize your mix
- Research your industry's typical engagement rates
- Track changes over time to spot patterns and adjust strategy
Social media success requires looking beyond basic metrics. Engagement rate gives you deeper insight into how well your content actually connects with followers. For practical tips on improving engagement across platforms, check out [How to Increase Engagement Rate on Different Platforms]. Need more social media management resources? Visit [Best Practices for Social Media Management]. Understanding and tracking engagement rate helps marketers, influencers and businesses create content that truly resonates with their audience.
2. Reach
Reach represents how many unique users have seen your content on social media. Unlike engagement metrics that count interactions, reach shows you the actual number of people who were exposed to your message. This key metric helps you understand your content's visibility and how effectively you're growing your audience.

Key Features:
- Shows total unique viewers of your content across organic and paid distribution
- Breaks down organic vs paid reach to evaluate each channel's performance
- Measures differently on each platform based on their specific systems
Advantages:
- Clear indication of content distribution success
- Direct measure of brand visibility and awareness
- Helps track how well content works with platform algorithms
Limitations:
- High reach doesn't guarantee engagement or action
- Numbers can change drastically day-to-day
- Platform updates can impact organic reach significantly
Real Examples:
- Facebook: Average organic posts reach only 5.2% of a page's followers, highlighting why strategic posting matters
- TikTok: The For You Page can help even small accounts reach massive audiences overnight. A local bakery's behind-the-scenes video might gain thousands of views through the algorithm.
How Reach Has Changed:
When social media marketing first emerged, organic reach was much higher. As platforms grew and algorithms became more selective about showing content, businesses had to work harder to maintain visibility. This made understanding and improving reach even more essential.
Tips to Improve Your Reach:
- Post when your audience is most active online
- Research and use relevant hashtags that match your content
- Create content people want to share with their networks
- Test different content types to see what resonates best
The key is consistency - track your reach over time and adjust your strategy based on what the data shows is working best for your specific audience.
3. Click-Through Rate (CTR)
Click-Through Rate (CTR) is one of the most important metrics in social media marketing. It shows what percentage of people who see your content actually click on your links or calls-to-action. This number is key because it directly shows how well your content gets people to take action, going beyond just counting views.
A good CTR tells you that your content connects with your audience and your calls-to-action work well. If your CTR is low, it could mean your content isn't quite right for your audience, your calls-to-action need work, or your links aren't placed effectively. Watching your CTR helps you make your social media work better.
Features and Benefits:
- Measures real engagement: Shows how many people actively click rather than just view
- Shows content quality: High CTR means your content truly interests your audience
- Points to conversions: While not guaranteed sales, clicks show people moving toward buying
Pros:
- Clear performance indicator: Directly shows if content successfully drives clicks
- Reveals user interest: Clicking shows genuine interest in what you're offering
- Helps improve results: Analyzing CTR lets you spot and fix what's not working
Cons:
- Different for each platform: Normal CTR levels vary between LinkedIn, Instagram, Facebook and others
- Link placement matters: Where you put your link affects how many clicks it gets
- Not the whole story: Clicks don't always mean completed purchases or sign-ups
Real-World Examples:
- LinkedIn paid content typically gets 0.35-0.45% CTR - this makes sense given its professional focus
- Instagram Stories often see 1-5% swipe-up rates, thanks to their engaging format
Tips to Improve Your CTR:
- Write clear action words: Use simple phrases like "Shop Now" or "Learn More"
- Try different link spots: Test putting links in different places to find what works best
- Make attractive previews: Use good images and descriptions for your links
CTR has become more important as social media has grown. For email marketers, ad agencies, and businesses promoting their work online, CTR offers concrete data about what works and what doesn't. By tracking and improving CTR, you can make your social media efforts more successful.
4. Share of Voice

Share of Voice (SOV) measures what percentage of social media conversations about your industry or topic mention your brand compared to competitors. This metric shows how visible and prominent your brand is online compared to others in your space. It's a key way to understand your market position and see if your social media efforts are making an impact.
How It Works
SOV looks at how often people mention your brand across social platforms versus your competitors. Beyond just counting mentions, modern SOV analysis also examines the sentiment behind those conversations - are people talking about your brand positively or negatively? Key aspects include:
- Brand mention monitoring: Tracking brand mentions across platforms
- Competitive analysis: Comparing your mention volume to competitors
- Sentiment tracking: Understanding if mentions are positive, negative or neutral
Real Example in Action
Let's look at two coffee chains - "Brew & Bites" and "Coffee Craze". When both launch new seasonal drinks, "Brew & Bites" finds they have 60% SOV compared to "Coffee Craze's" 40%. This shows "Brew & Bites" generated more buzz and discussion, suggesting stronger customer interest.
History and Rise
While Share of Voice existed in traditional marketing, it really took off for social media with tools like Brandwatch and Sprout Social. These platforms made it much easier to track and analyze online conversations at scale.
Key Benefits
- Clear market position: See how visible your brand is compared to competitors
- Spot trends: Identify emerging topics in your industry
- Gauge strategy: Determine if your social content resonates with audiences
Main Challenges
- Complex measurement: Requires careful keyword selection and filtering
- Tool costs: Often needs paid monitoring software
- Mention quality: Raw mention counts may not reflect true engagement
Tips for Getting Started
- Track relevant industry and campaign hashtags
- Monitor competitor brand mentions and engagement
- Use social listening tools to automate tracking
- Focus on mention quality over just quantity
Understanding your Share of Voice helps you see where your brand stands and lets you adjust your strategy to have a bigger impact in online conversations about your industry.
5. Video Completion Rate
Video completion rate shows the percentage of viewers who watch a video all the way through. This metric gives you clear data about how engaging your video content is and whether viewers stay until the end. For social media marketers and content creators, understanding viewer behavior can make a major difference in results.
As platforms like TikTok, Instagram Reels, and YouTube Shorts have made short videos central to social media, analyzing video performance has become essential. When viewers consistently watch your full videos, it's a strong sign that your content resonates and delivers value.
Features and Benefits:
- Direct Engagement Measurement: See exactly how many viewers stay engaged through the entire video, revealing where interest drops off
- Content Quality Indicator: Higher completion rates mean your storytelling, messaging and visuals hit the mark with viewers
- Platform-Specific Data: Access completion rate data unique to each social platform to refine your approach
Pros:
- Clear Content Performance: High completion rates mean your videos effectively deliver their message
- Length Optimization: Compare completion rates across different video lengths to find what works best
- Deep Engagement: Full video views show stronger audience investment than simple view counts
Cons:
- Length Impact: Naturally shorter videos tend to have better completion rates
- Platform Differences: Each platform calculates rates differently, making comparisons tricky
- Limited Context: Someone might watch the full video but not take action or absorb the message
Benchmarks and Examples:
Looking at platform data shows key differences in viewer behavior. On TikTok, where videos are short and snappy, completion rates average around 90%. Meanwhile, YouTube sees 50-60% completion on longer content. This shows how platform and length affect viewer follow-through.
Tips to Boost Completion Rates:
- Strong Opening: Hook viewers in the first 3-5 seconds with compelling visuals or questions
- Ideal Length: Keep videos focused and concise, testing different lengths with your audience
- Engaging Thumbnails: Use eye-catching preview images to drive initial clicks
Why This Metric Matters:
Video completion rate gives you concrete data about content effectiveness. By tracking and improving this number, you can create videos that keep viewers watching and drive real business results. For any team using video content, this metric deserves close attention and regular optimization.
6. Sentiment Analysis
Sentiment analysis looks at the emotional reactions and feelings behind how people talk about your brand or products on social media. By reading comments and posts and identifying whether they express positive, negative, or neutral opinions, it helps you understand what your audience really thinks.
Key Benefits:
- Get emotion-based insights, not just numbers
- Track your brand's reputation across social media
- Spot potential issues before they become problems
- Find out what content resonates with your audience
The technology uses AI and machine learning to analyze social media text. Think of it like a smart sentiment detector - it scans for language patterns that suggest different emotions. A comment like "This product is amazing!" gets tagged as positive, while "Worst update ever, I'm switching brands" registers as negative.
Real-World Applications:
- A chain restaurant analyzes Yelp reviews and discovers common complaints about slow service at one location. They make targeted improvements based on the feedback.
- A software company tracks reactions to their new release. After seeing negative comments about a particular feature, they quickly fix the issue.
- A political campaign gauges voter sentiment on key issues to refine their messaging strategy.
The tools for sentiment analysis have become more accessible through platforms like Hootsuite and Mention, making it possible for businesses of any size to gain these insights.
Advantages and Limitations:
Pros:
- Provides quality insights into audience feelings
- Helps catch problems early
- Makes content planning more effective
Cons:
- Can miss sarcasm and context
- Needs specialized tools
- Language/slang challenges
Tips for Success:
- Use multiple analysis tools to cross-reference results
- Look at sentiment changes over weeks and months
- Respond quickly to negative feedback
- Track patterns in how sentiment shifts
Who Benefits from Sentiment Analysis:
This approach helps many different roles:
- Email marketers crafting subject lines
- Social media managers planning content
- Event planners monitoring feedback
- Sales teams identifying leads
- Real estate agents tracking market opinions
- Recruiters assessing candidate responses
- Influencer marketers measuring campaigns
- Consultants understanding client needs
By revealing how people really feel about your brand, sentiment analysis gives you the insights needed to build stronger connections with your audience and make smarter business decisions.
7. Amplification Rate
Amplification rate shows how much your social media audience shares your content. It's a simple ratio: shares per post divided by total followers. Unlike basic metrics like likes and comments, this number reveals your true content reach and influence.
When your content gets shared, it means people found it valuable enough to spread to their own networks. A high amplification rate shows your message resonated deeply enough that followers became active promoters. In social media marketing, this organic sharing is incredibly powerful for expanding beyond your direct followers.
Key Features:
- Tracks sharing frequency and volume
- Measures content's ability to spread
- Shows audience advocacy levels
Advantages:
- Proves real audience support through active sharing
- Demonstrates content value and impact
- Helps identify potentially viral posts
Limitations:
- Platform differences make comparisons tricky (LinkedIn: 1-2% vs Twitter: 0.5-1.5%)
- Some content types naturally get more shares
- High shares don't always mean high quality - controversial posts can spread fast too
Example Case: Two content creators both have 10,000 followers. Creator A gets 500 shares on a post (5% rate) while Creator B gets 100 shares (1% rate). This shows Creator A's content connects much better with their audience.
Growth Over Time: Social media evolved from chasing follower counts to focusing on real engagement. Amplification rate emerged as a way to measure genuine audience connection. For tips on working with influencers to boost your own rates, check out How to Leverage Influencer Marketing for Maximum Impact.
Best Practices:
- Design content specifically for sharing - eye-catching visuals, useful information, engaging stories
- Ask directly for shares with clear calls-to-action
- Study your highest-performing posts to identify what makes content shareable
For more ways to increase engagement, read [Strategies to Boost Engagement on Social Media]. Following these tips while tracking your amplification rate can significantly improve your social media results.
8. Response Rate & Time
Social media responses are a key metric showing how well brands connect with their audience. Response Rate & Time measures your speed and consistency in handling comments, messages, and mentions. This metric reflects customer satisfaction levels and business success, making it essential for any social media strategy.
Understanding Response Rate & Time
This metric has two main parts:
- Response Speed: The average time between when customers reach out and when your brand replies
- Response Rate: What percentage of messages get responses. A high rate shows commitment to engagement, while low rates may indicate understaffing or other issues.
Features and Benefits:
- Speed Tracking: Measures how quickly your team handles customer messages
- Service Quality: Shows how well your social media customer support performs
- Interaction Quality: Goes deeper than surface metrics to show meaningful engagement
Pros:
- Service Excellence: Quick responses show customers you care
- Higher Satisfaction: Fast replies lead to happier customers
- Customer Loyalty: Responsive brands build stronger relationships
Cons:
- Staff Needs: Quick responses require dedicated social media teams
- Time Zone Issues: Global audiences make 24/7 coverage challenging
- Platform Differences: Each social network has unique messaging systems
Real-World Examples:
When a customer tweets about a delayed order, responding within minutes with a solution can turn frustration into appreciation. But ignoring that tweet risks public backlash. Studies back this up - SproutSocial research found 40% of customers expect responses within an hour on social media.
Growth and Changes:
As social media has evolved to real-time communication, response expectations have risen sharply. Brands that can't keep up appear disconnected from customers. This shift has driven the creation of social media management tools to help track and improve response times.
Tips for Better Response Times:
- Set Clear Goals: Use industry benchmarks (Facebook: 1-2 hours, Twitter: 85% response rate)
- Use Management Tools: Pick platforms that streamline workflows and tracking
- Create Response Templates: Save time with pre-written answers to common questions
- Have Priority Systems: Identify urgent issues needing immediate attention
By making Response Rate & Time a priority, you can turn your social presence into an active customer engagement hub. This helps build stronger customer relationships and improves your brand's reputation.
9. Cost Per Engagement (CPE)
Cost Per Engagement (CPE) is a key measurement for paid social media advertising that shows how much you spend per interaction with your sponsored content. These interactions include likes, comments, shares, clicks, and saves. Understanding your CPE helps you check if your advertising budget is being used wisely.
Think of CPE as answering: "What am I spending for each time someone engages with my ads?" This detailed view helps you adjust your campaigns to get better results.
Why CPE Matters:
CPE directly shows if your ad spending is working well. Unlike simple follower counts, CPE tells you exactly what you're paying for real interactions. This helps you make smart choices about your campaigns based on actual data.
Key Benefits:
- Measures Results: Shows how well your ads get people to interact. Lower CPE usually means better performance.
- Shows Return on Investment: Helps you see if you're getting good value from your ad spending
- Platform-Specific Data: Major social networks provide CPE data in their ad dashboards
Advantages:
- Clear Performance View: Shows if your ads connect with your target audience
- Better Budget Use: Identifies which ads cost too much per engagement so you can improve them
- Easy Comparison: Let's you compare different campaigns and platforms to find what works best
Challenges:
- Platform Differences: Average costs vary widely - Facebook CPE is typically $0.11-$0.18, while Instagram runs $0.20-$0.35
- Targeting Impact: Very specific audience targeting can increase costs
- Quality vs Quantity: A like isn't equal to filling out a lead form, but CPE counts them the same
Real Example:
Consider two companies spending the same amount on ads. Company A gets interactions for $0.05 each, while Company B pays $0.20 per engagement. Company A is getting 4x more interactions for their money - showing how CPE reveals big differences in ad performance.
History and Growth:
As social media ads became more common and budgets grew larger, businesses needed better ways to track performance. CPE became important because it shows exactly what companies get for their money. More businesses now use it to check if their social ads are worth the cost.
Tips for Success:
- Test different ad types like images, videos and carousels to find what gets the lowest CPE
- Fine-tune your audience targeting to reach people most likely to engage
- Check average CPE numbers for your industry to see how you compare
By watching and improving your CPE over time, you can make sure your social media ad budget drives real engagement that helps meet your marketing goals.
10. Follower Growth Rate
Follower growth rate shows how quickly your social media account gains new followers over time. As a vital performance indicator, it helps social media managers understand if their content strategy effectively grows their audience and brand presence.
This metric goes deeper than raw follower counts by focusing on growth velocity. It examines net growth (new followers minus unfollows) and follower acquisition sources like hashtags, profile visits, and ad campaigns. For example, if you see a big jump in followers after using certain hashtags, you've found a highly engaged audience segment.
With modern social media tools, tracking follower growth is straightforward. Most platforms provide detailed analytics, while specialized tools offer even more granular data about audience growth patterns and trends.
Key Benefits:
- Brand Health Tracking: Steady follower growth indicates strong brand momentum
- Content Performance: Spikes in followers often mean your content resonates well
- Simple Analytics: Built-in platform tools make measurement easy
Main Challenges:
- Engagement Matters More: A smaller, highly engaged following beats large inactive numbers
- Risk of Fake Growth: Purchased followers can distort true performance metrics
- Context Required: Growth rates need analysis alongside reach and engagement data
Real-World Examples:
- Instagram Growth: For established accounts, 1-5% monthly growth is considered healthy
- TikTok Growth: New TikTok accounts can see 10-20% monthly growth due to the platform's viral nature
Best Practices:
- Track net follower changes (new follows minus unfollows)
- Monitor sudden unfollows to spot content issues
- Analyze where new followers come from to refine your strategy. Learn more about customized social strategies at OKZest.
Consider a small business that launched a targeted Instagram campaign using strategic hashtags and engaging visuals. Their follower growth jumped from 1% to 8% in one month, directly boosting brand awareness and website traffic. This shows how quality content and smart targeting drive follower growth.
You might be interested in: [Title of related blog post about content strategy]
Read also: [Title of related blog post about social media analytics tools]
By tracking follower growth alongside other engagement metrics, you get a clear picture of your social media performance and can make data-driven decisions to improve your strategy and reach your marketing goals.
10-Point Social Media Engagement Metrics Comparison
| Metric | 🔄 Complexity | ⚡ Resources | 📊 Outcomes | ⭐ Advantages | 💡 Use Cases / Tips |
|---|---|---|---|---|---|
| Engagement Rate | Medium – requires data aggregation and calculation | Low – uses readily available social media metrics | Standardized measure of audience interaction | Accurate benchmarking and clear content insight | Analyze content trends; benchmark against competitors; separate by content type |
| Reach | Low – based on aggregate visibility data | Moderate – depends on platform-specific analytics | Gauge of content distribution and brand exposure | Indicates brand awareness and algorithm performance | Optimize post timing; use relevant hashtags; increase shareability |
| Click-Through Rate (CTR) | Medium – influenced by link placement and content style | Low – basic campaign analytics data | Indicator of conversion potential and audience intent | Direct measure of content effectiveness | Test CTAs; experiment with link positions; craft compelling link previews |
| Share of Voice | High – requires comprehensive monitoring tools | High – advanced social listening and analysis tools | Reveals market position and competitor conversation | Measures brand relevance with comparative insights | Monitor competitor mentions; track sentiment trends; use social listening tools |
| Video Completion Rate | Medium – focuses on video-specific data analysis | Moderate – uses platform video analytics | Measures viewer retention and content engagement | Indicates video quality and content appeal | Optimize first few seconds; keep videos concise; design engaging thumbnails |
| Sentiment Analysis | High – involves complex AI/ML and nuance detection | High – requires sophisticated analysis tools | Assesses emotional tone and brand perception | Provides qualitative insights and early issue detection | Use multiple analysis tools; monitor sentiment trends; respond quickly to negative feedback |
| Amplification Rate | Medium – calculated from shares and follower counts | Low – based on basic sharing metrics | Reflects viral potential and audience advocacy | Demonstrates content value and shareability | Encourage sharing; create highly shareable content; analyze high-performing posts |
| Response Rate & Time | Medium-High – tracking and consistency measurement | Moderate – customer service/automation tools | Evaluates customer service and engagement quality | Enhances brand loyalty through prompt responses | Set clear response goals; deploy automation tools; maintain consistent communication templates |
| Cost Per Engagement (CPE) | Low-Medium – based on ad spend and engagement tracking | Low – uses campaign and financial data | Assesses ad effectiveness and return on investment | Optimizes ad spend and campaign performance | Test different ad formats; refine targeting; compare against industry benchmarks |
| Follower Growth Rate | Low – straightforward tracking of follower numbers | Low – uses basic analytics tools | Indicates brand momentum and audience appeal | Easy to measure and signals content success | Monitor net growth; analyze sources of growth; track unfollow patterns |
Taking Action With Your Insights
Got your key social media metrics figured out? Great! Now it's time to put that knowledge to work. Start by picking the metrics that match what your business wants to achieve. If you're trying to get your brand name out there, keep an eye on Reach and Share of Voice. Want more website visitors? Track that Click-Through Rate (CTR). Building community? Focus on Engagement Rate, how people feel about your posts, and how quickly you respond to them.
Set up a simple system to check these numbers regularly. Look for patterns in what works - which posts get the most likes and comments? When do your followers seem most active? Which social platforms give you the best results for your effort? These details help you make smarter choices about your content.
Social media doesn't stand still, so keep learning as you go. Watch out for new platform features and changes in how people use social media. When you stick to what the data tells you and stay flexible, you'll be able to keep improving your results over time.
Key Takeaways:
- Pick metrics that directly connect to your business goals
- Check your numbers consistently and understand what they mean
- Update your approach based on what works
- Keep up with important social media changes
Looking to make your social media stand out? OKZest helps you automatically create custom images for your social posts, emails, and other marketing. Whether you need personalized messages or unique certificates, you can make content that speaks to each person individually. This helps boost engagement, build stronger connections, and turn more viewers into customers. Ready to start creating eye-catching personalized images? Check out OKZest today!